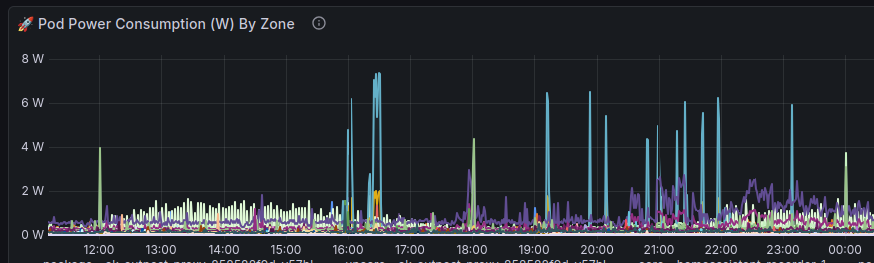
Here is a bit of data that I haven't figured out a solid use case for
This is a one day graph of power usage of every container in the cluster
Any guesses what the big spikes are?
@homelab@fedigroups.social #HomeLab #Observability
Here is a bit of data that I haven't figured out a solid use case for
This is a one day graph of power usage of every container in the cluster
Any guesses what the big spikes are?
@homelab@fedigroups.social #HomeLab #Observability