Federation Bot @Federation_Bot · activity timestamp last week Monthly CO2 emissions air traffic the Netherlands. Read more Read less Translate Translate alt Graph showing monthly co2 emissions (thousands of tonnes) by airtraffic in the Netherlands, since 2010. It follows a seasonal pattern, with a peak in August and a bottom in February. The 12 month average trend goes from 800 thousend tonnes co2 in 2010 to 920.000 in 2019. It then drops to 500 thousend tons during Corona. Now it is back up at 895 thousand tonnes. Graph showing monthly co2 emissions (thousands of tonnes) by airtraffic in the Netherlands, since 2010. It follows a seasonal pattern, with a peak in August and a bottom in February. The 12 month average trend goes from 800 thousend tonnes co2 in 2010 to 920.000 in 2019. It then drops to 500 thousend tons during Corona. Now it is back up at 895 thousand tonnes. Reply Boost Quote Like More actions Copy link Flag this post Block
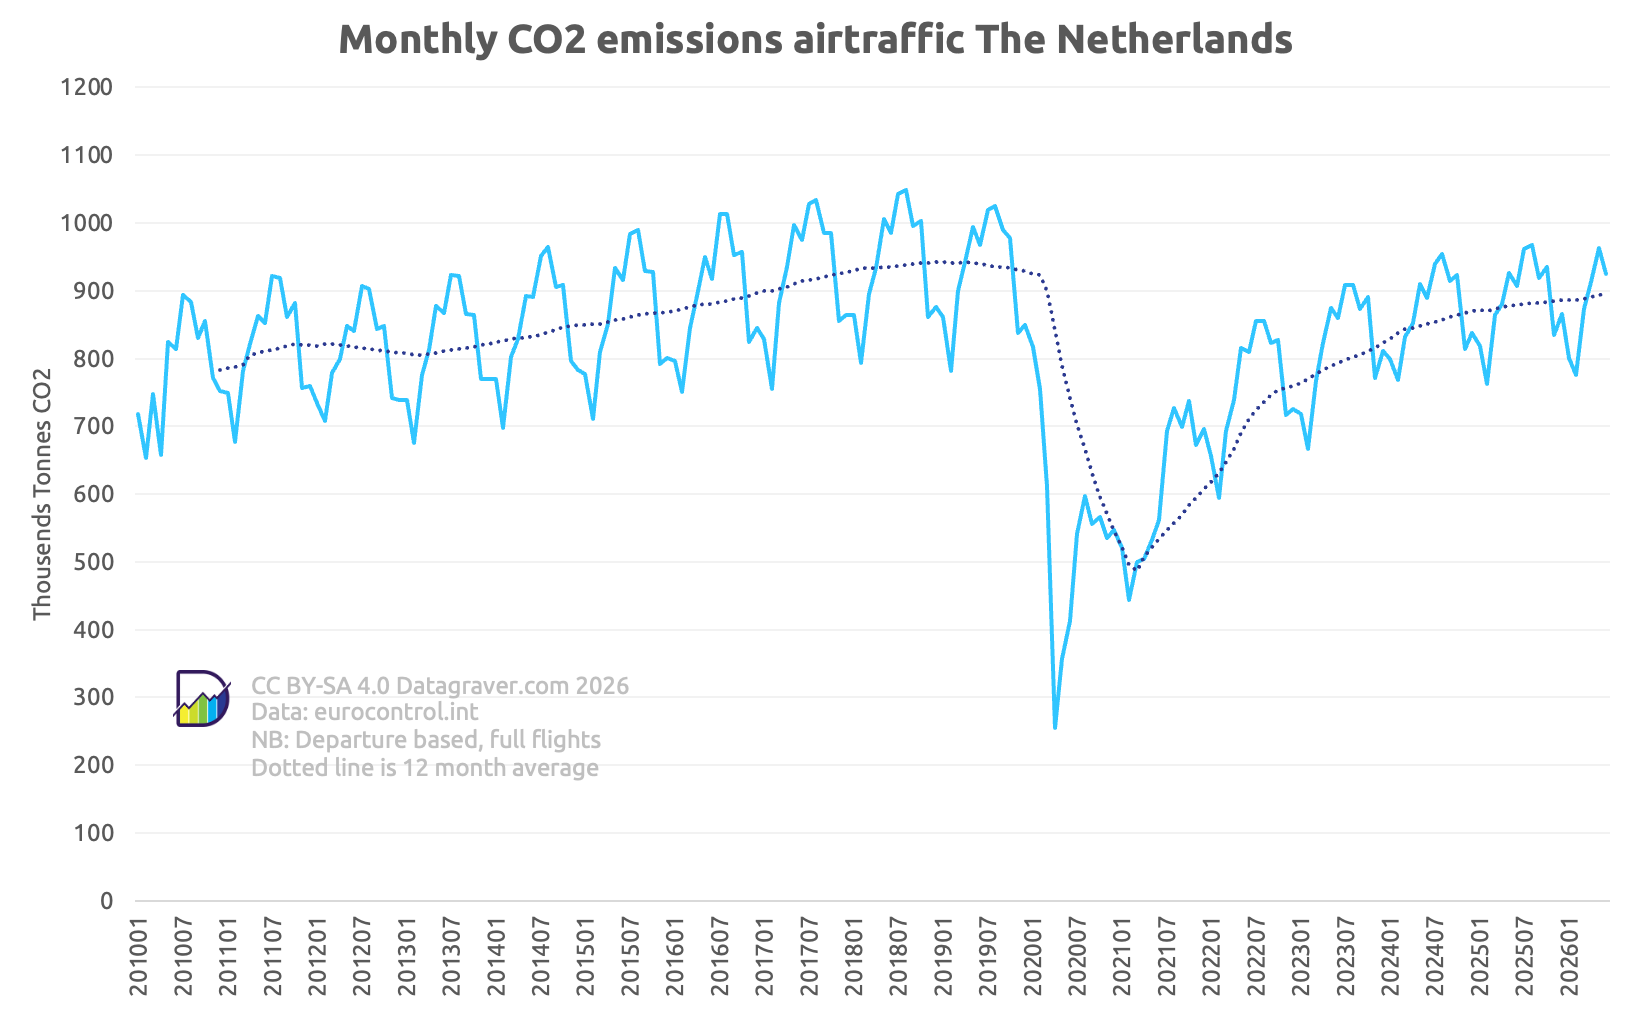
alt Graph showing monthly co2 emissions (thousands of tonnes) by airtraffic in the Netherlands, since 2010. It follows a seasonal pattern, with a peak in August and a bottom in February. The 12 month average trend goes from 800 thousend tonnes co2 in 2010 to 920.000 in 2019. It then drops to 500 thousend tons during Corona. Now it is back up at 895 thousand tonnes. Graph showing monthly co2 emissions (thousands of tonnes) by airtraffic in the Netherlands, since 2010. It follows a seasonal pattern, with a peak in August and a bottom in February. The 12 month average trend goes from 800 thousend tonnes co2 in 2010 to 920.000 in 2019. It then drops to 500 thousend tons during Corona. Now it is back up at 895 thousand tonnes.